Address of Medical Laboratory:
 Customer Service Email:
 Service Hotline:TEL:
 Website:
Tumor Inflammation Signature can be used to evaluate pathway blockage response status of PD-1/PD-L1 inhibitors.
The peripherally suppressed immunization reaction can be determined and the "hot" or "cold" tumors can be identified without distinguishing the tissue source of cancer cells. It is related to the interferon pathway and is a positive indicator related to the efficacy of PD-1/PD-L1 inhibitors. It is a potential surrogate biomarker for PD-L1 expression and tumor mutation burden.
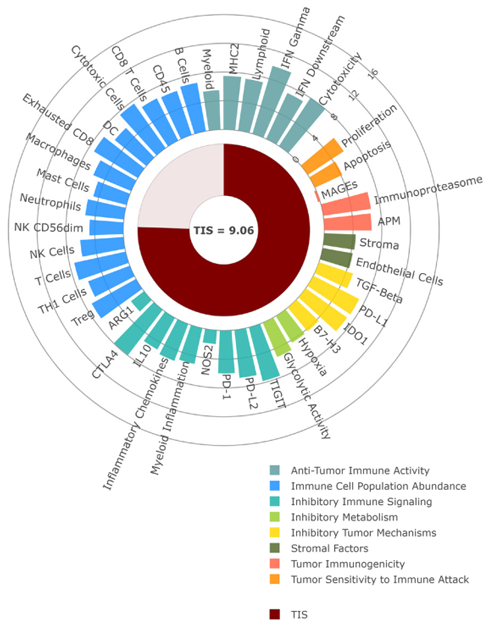
Taking the analysis of a single sample as an example, the characteristic signature score of the selected sample is shown in the figure below. The TIS is in the middle, and the score range is about 0-10. For most characteristic signature scores, the average score is 5 points. Each increase in the score unit corresponds to the doubling of the biological process measured by it. The color indicates the biological function of each characteristic signature.
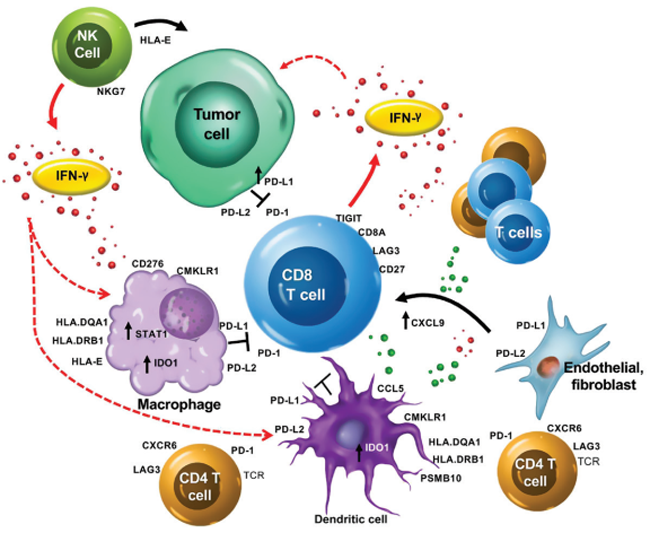
The tumor microenvironment is a place where tumor cells, tumor invasion immune cells and surrounding stromal cells have complex and continuous interactions. The characteristics of transcription patterns in the tumor microenvironment can reflect the evolutionary strategy of dynamic interactions occurring during tumor immune escape-mediated surveillance and clearance. Understanding the various escape strategies in specific tumor types and pan-cancers can accelerate the development of new therapies for specific patient groups. The Yuce iSignature™ PanCancer Panel is a unique 770 gene expression panel based on the nCounter platform. It covers important factors related to the complex interactions between tumor, microenvironment and cancer immunization reaction, and can perform full characterization and evaluation of tumor biology and tumor immune escape mechanisms, respectively.
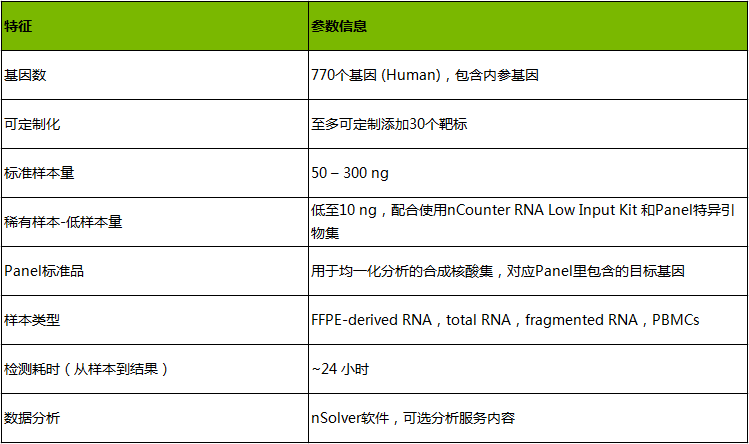
Specific parameters of the product
Yuce iSignature™ PanCancer Panel 16 key tumor immune signaling pathways and processes
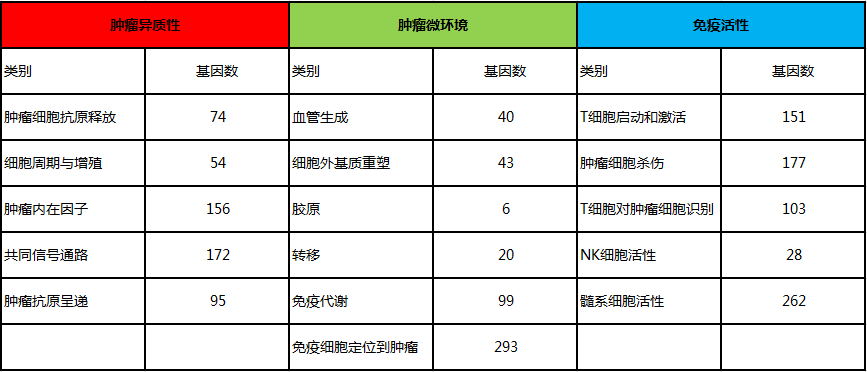
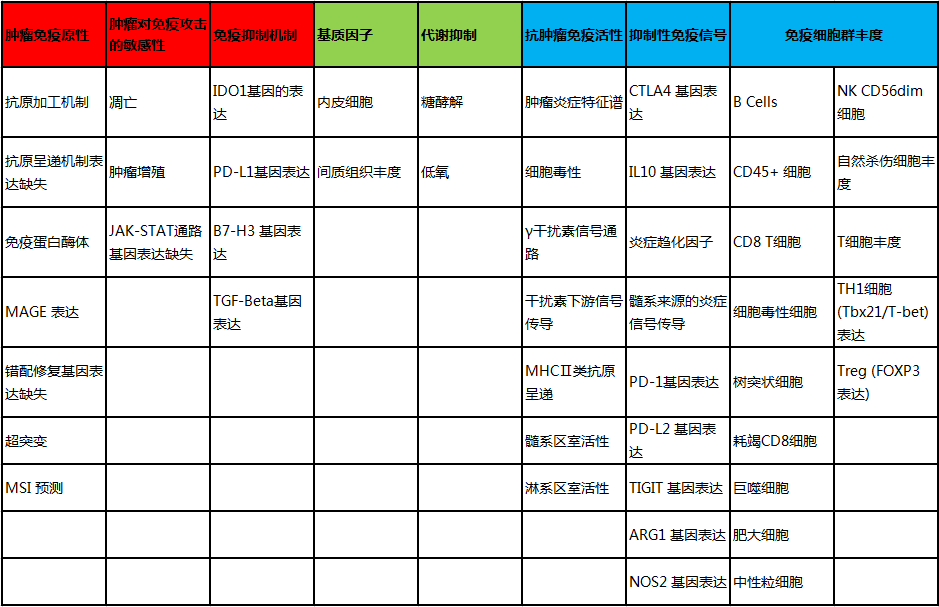
Yuce iSignature™ PanCancer Panel biological characteristic signatures
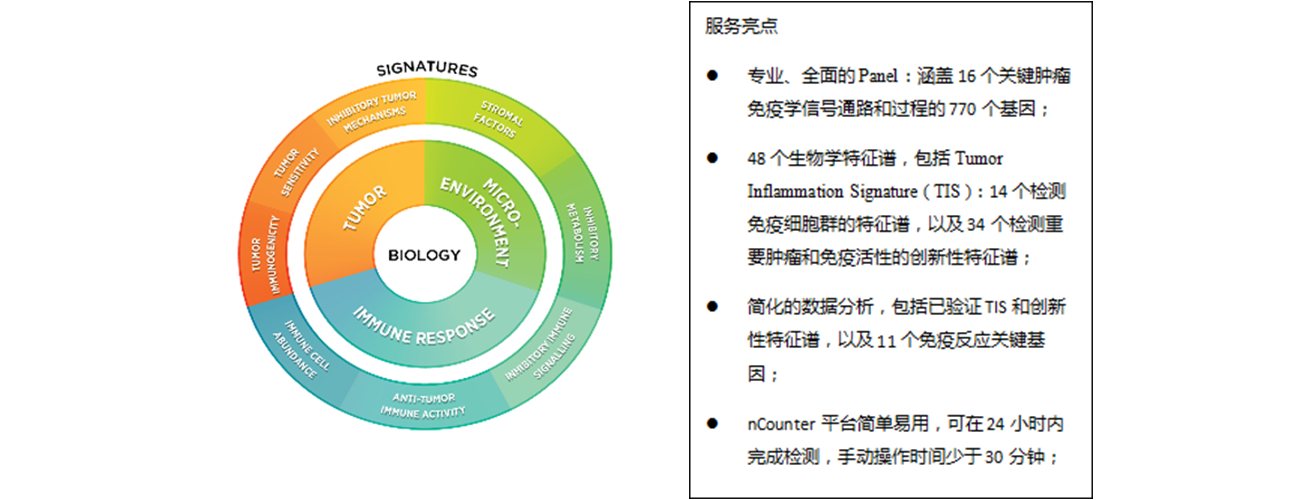
The 48 biological signatures involved in this product are critical to tumor-immune interactions, and can be classified according to 8 different biological functions: tumor immunogenicity, tumor sensitivity to immune attack, immunosuppression mechanism, matrix factor, metabolic inhibition, anti-tumor immune activity, suppressive immune signal, and abundance of immune cell population.
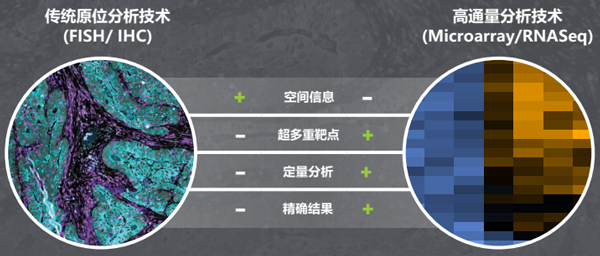
The complexity of the tumor immune microenvironment and the heterogeneity of samples are major challenges facing current tumor immune research and translational medicine. Existing tissue analysis requires a difficult choice between morphological imaging technology and high-throughput analysis technology, sacrificing important spatial information or wasting a large number of precious samples.
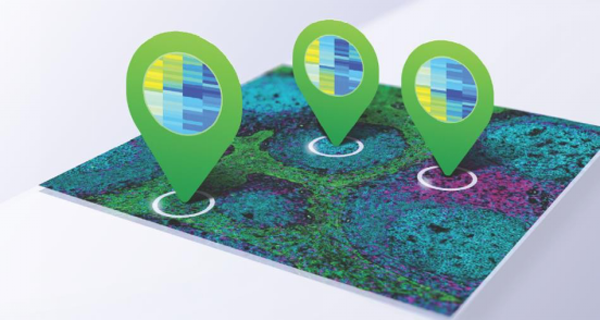
Yuce's newly launched Yuce TIME™ DSP digital spatial multi-omics analysis service combines tissue image analysis and in-situ digital quantitation technology. With the aid of single-cell resolution high-definition tissue images, it can currently perform simultaneous analysis of tens of thousands of different RNAs (Cancer Transcriptome Atlas 1800+ RNAs and Whole Transcriptome Atlas 18000+ RNAs) or dozens of different proteins (≤ 96) for quantitative analysis, and can analyze up to 12 FFPE tissue sections in a day. In addition, users can realize custom protein and RNA targets through customized services.
Digital spatial multi-omics analysis technology
Process flow of Yuce TIME™ DSP multi-omics analysis
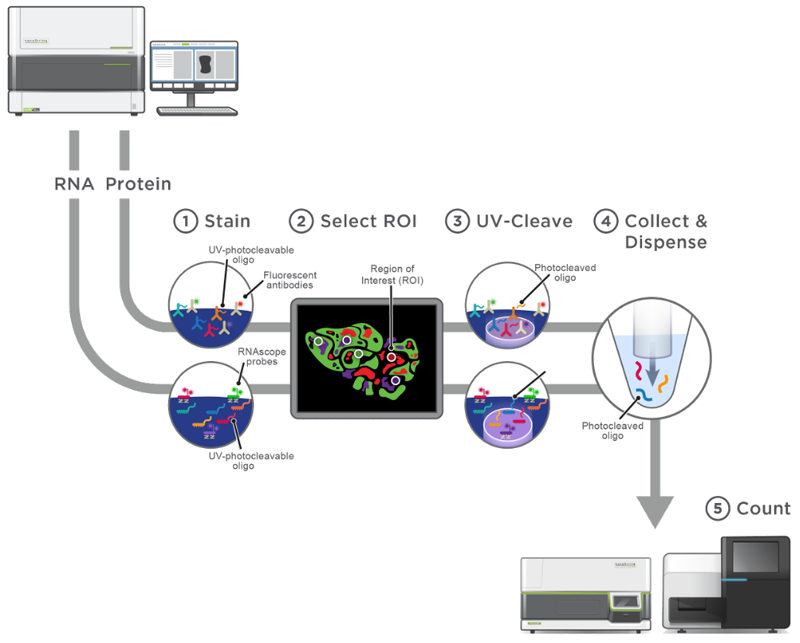
1. Multi-target antibody staining
2. Select the region of interest (ROI) based on the fluorescent antibody staining image
3. UV irradiate each ROI and cut the Oligo
4. Draw the Oligo of each ROI using the capillary
5. After all the Oligos in the ROI are collected separately, use the nCounter platform or the sequencing platform to quantify Oligo
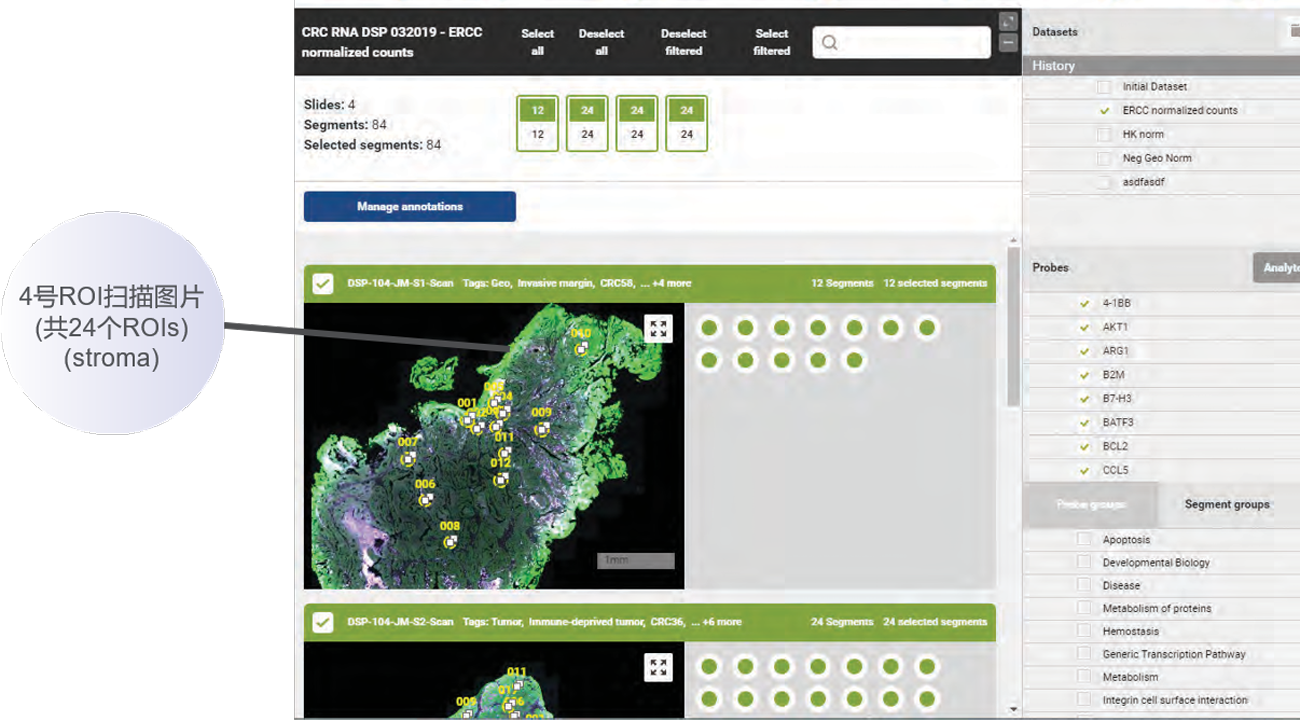
100% interconnection of tissue scan pictures and quantitative results of Protein & RNA spatial analysis: When the spatial quantitative results of the ROI region are selected in the software, the software will automatically display the tissue scan pictures corresponding to the ROI region, and vice versa.
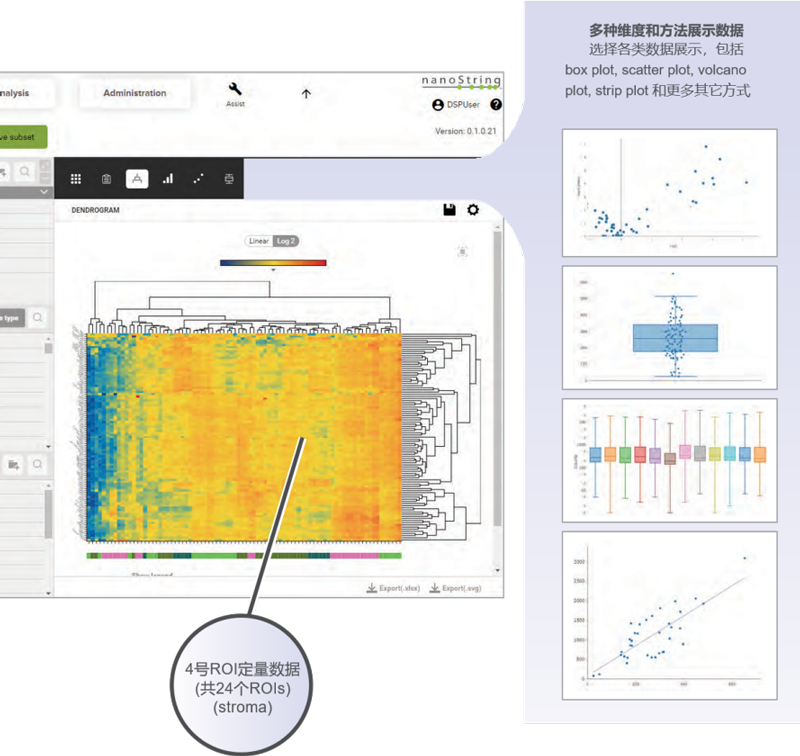
Yuce TIME™ DSP multi-omics data analysis solution
Full-featured: Fully integrate the process from data collection to data analysis
Simple operation: Real-time interconnection of scanned images and quantitative data
Assistance in cooperation: Multiple users with different permissions can evaluate and analyze data in multiple locations and at the same time
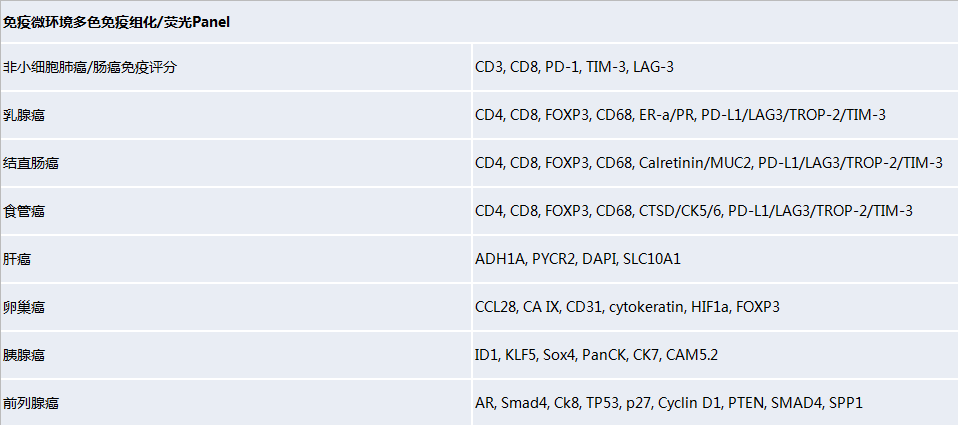
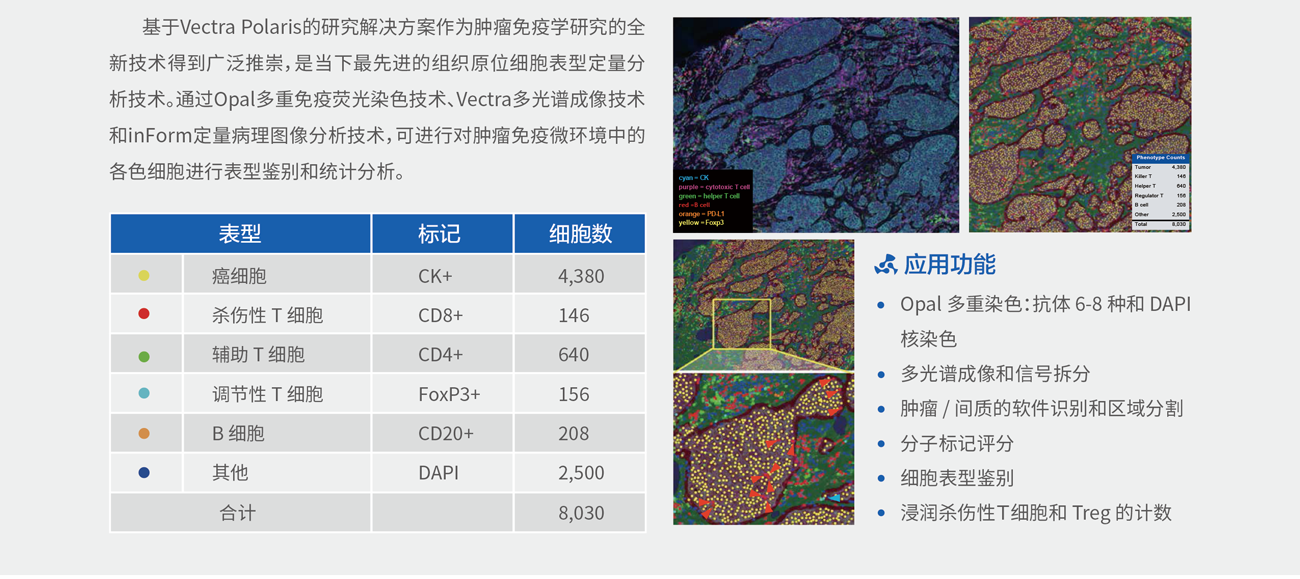
The Yuce TIME™ mIHC/mIF series products are based on Opal multi-immunofluorescence staining technology, Vectra multispectral imaging technology and quantitative pathological image analysis technology, and can perform phenotypic identification and statistical analysis of cells of different colors in the tumor immune microenvironment.
Application Functions
• Intelligent recognition of specific morphological tissue regions (tumor/matrix)
• Quantitative analysis of staining signal intensity of tissue samples
• Calculation and analysis of staining area
• Assay of the number of positive cells or quantitative pathological score
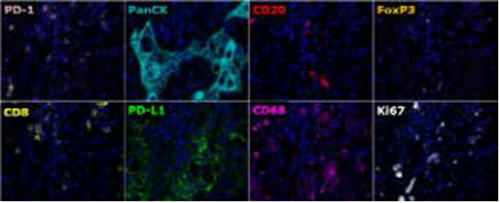
Figure: Sample of Opal 9-color fluorescence-labeled lung cancer tumor sample image
YuceNeo can provide phenotypic identification and statistical analysis of cells of different colors in the tumor immune microenvironment.
Copyright©2021
Shenzhen yucebio Technology Co., Ltd. all rights reserved
Yueicp no.16128839